Feedburner used to have a really nice RSS subscriber growth graph. I loved it. But then one day they were acquired by Google and they changed their nice chart to an interactive flash thing that was slow and looked just awful.
Here is how awesome the graph used to look like:
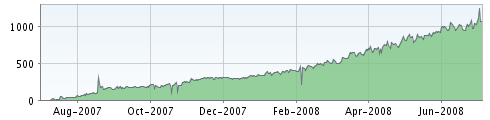 This graph was taken from my "one year of blogging" post.
And how it looks now:
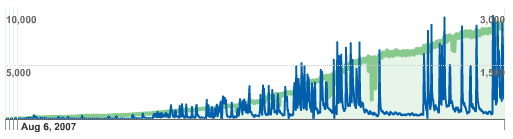 This graph was taken from Feedburner stats dashboard today.
Choose "Show stats for" -> "all time" to generate this graph.
This piece of shit takes 35MB of RAM, responds in 4 seconds and looks fucking ugly. I don't know why would anyone replace a nice 6.5KB image with a 35MB monstrosity.
I don't want to see this bullshit anymore, therefore I'll create a Perl program that generates the awesome graph they used to have. I'll write my thought process in creating this program in this post. Here it goes.
First I need to get the data somehow. I remember they had some kind of an API to get the data. A quick Google search for feedburner api returns this link Feedburner Awareness API. Ya, that's it. This is the documentation of their API.
Accessing the following URL gets me subscriber count data from July 1, 2007 to November 17, 2009:
http://feedburner.google.com/api/awareness/1.0/GetFeedData?uri=catonmat&dates=2007-07-01,2009-11-17
Excellent, now I can write the Perl program. It will need to parse the XML data, draw the chart and save the image to a file.
Hmm, how should I invoke my program? Ok, here is how:
$ generate_feedburner_graph.pl <<strong>feed name</strong>> [<<strong>start date</strong>> [<<strong>end date</strong>>]] # if <strong>end date</strong> is not specified, it's set to today. # if <strong>start date</strong> is not specified, it's set to first # day when the feed had at least one subscriber.
This program will use LibGD to generate the image. It will save it to a file called feed_name-start_date-end_date.png.
Now I need to find the colors used in the awesome feedburner graph. For this purpose I'll use ColorZilla Firefox plugin. The green one is #95CF9C, the background is #F2F8FC, the light grid is #CCCECE, the one that separates the green area from background is #687279, and the x-y axis are #808080.
Alright, now I have everything I need to create the program.
... Several hours later ...
Done!
One thing I forgot to mention is that you will need DejaVuSans TrueType font to run this program (it uses it to draw text). Download it and put the DejaVuSans.ttf in the same directory as the program.
#!/usr/bin/perl
#
# Feedburner graph generator
# Version 1.0
#

use warnings;
use strict;

use WWW::Mechanize;
use List::Util 'max';
use XML::Simple;
use POSIX;
use GD;

# This is the API URL that returns XML data with feed statistics by day.
my $feedburner_url = "http://feedburner.google.com/api/awareness/1.0/GetFeedData?uri=%s&dates=%s,%s";

# This function prints the usage and terminates the program.
sub usage {
    printf "Usage: %s <feed name> [<start date> [<end date>]]\n", $0;
    print "Parameters:\n";
    print "<feed name>  - your feed name, for example 'catonmat'\n";
    print "<start date> - start date (YYYY-MM-DD)\n";
    print "<end date>   - end date (YYYY-MM-DD), today if not specified\n";
    exit(1);
}

# This function checks if DejaVuSans font is present, if not
# it prints the instructions on how to download and terminates the program.
sub check_dejavu_sans {
    unless (-e 'DejaVuSans.ttf') {
        print "Please download DejaVu fonts and put DejaVuSans.ttf file in\n";
        print "the same directory as this program.\n";
        print "http://dejavu-fonts.org/wiki/index.php?title=Download\n";
        exit(1);
    }
}

# Given year, month, day from `struct tm` (man 3 mktime),
# it constructs a YYYY-MM-DD string.
sub format_date {
    my ($y, $m, $d) = @_;
    return sprintf("%04d-%02d-%02d", $y+1900, $m+1, $d);
}

# Given the `struct tm` (man 3 mktime) as a 9-list (perldoc -f localtime),
# it constructs a YYYY-MM-DD string.
sub yyyymmdd_from_9list {
    my ($y, $m, $d) = @_[5,4,3];
    return format_date $y, $m, $d;
}

# This function returns a YYYY-MM-DD string for today.
sub today {
    return yyyymmdd_from_9list localtime
}

# This function constructs the 9-list (perldoc -f localtime) for a
# date that was $months_ago months ago.
sub months_ago {
    my $months_ago = shift;
    my @date = @_;
    $date[4] -= $months_ago;
    return localtime mktime @date;
}

# Given feed data from feedburner's api (array of hashrefs), it finds
# the first date that had non-zero circulation.
# If no such date exists, it returns undef.
sub find_first_nonzero {
    my @feed_data = @_;
    return if $feed_data[0]->{circulation} != 0;
    my $prev_item;
    for my $item (@feed_data) {
        return $prev_item if $item->{circulation};
        $prev_item = $item;
    }
    return
}

# Given feed's name, this function finds the first date the
# feed had some subscribers, i.e., feed's start date.
sub find_start_date {
    my $feed = shift;
    print "Finding feed's start date...\n";
    my @ago = months_ago 6, localtime;
    my $end_date = today();
    while (1) {
        my $start_date = format_date @ago[5,4,3];

        print "Trying $start_date as start date...\n";
        my @feed_data = get_feed_data($feed, $start_date, $end_date);
        my $non_zero = find_first_nonzero(@feed_data);
        if ($non_zero) {
            print "Found $non_zero->{date} as start date!\n";
            return $non_zero->{date};
        }

        $end_date = yyyymmdd_from_9list @ago;
        @ago = months_ago 6, @ago;
    }
}

# This function returns an array of hashrefs of feeds data.
# Each hash contains 'reach', 'hits', 'date', and 'circulation' keys.
sub get_feed_data {
    my $raw_feed_data = get_raw_feed_data(@_);
    my $feed_data = XML::Simple->new->XMLin($raw_feed_data);
    if ($feed_data->{stat} ne "ok") {
        die $feed_data->{err}{msg}
    }
    return @{$feed_data->{'feed'}{'entry'}};
}

# This function formats the $feedburner_url and uses WWW::Mechanize
# to get the feed data via feedburner's API.
sub get_raw_feed_data {
    my ($feed, $start_date, $end_date) = @_;
    my $url = sprintf($feedburner_url, $feed, $start_date, $end_date);
    return WWW::Mechanize->new(agent => 'Mozilla/5.0 (Windows; U; Windows NT 5.1; en-US; rv:1.9.1.5) Gecko/20091102 Firefox/3.5.5')->get($url)->content;
}

# This function drops feed items when they can't fit in graph's width.
sub drop_data {
    my ($width, @data) = @_;
    my $len = $#data;
    my $delta = @data - $width;
    my @drop = map { int($len / $delta * $_) } 1..$delta;
    splice @data, $_, 1 for reverse @drop;
    return @data;
}

# This function duplicates feed items when there are not enough items
# to fill the whole graph.
sub dupe_data {
    my ($width, @data) = @_;
    my $len = $#data;
    my $delta = $width - @data;
    my @dupe = map { int($len / $delta * $_) } 1..$delta;
    splice @data, $_, 0, $data[$_] for reverse @dupe;
    return @data;
}

# This function draws the outline of the graph box where the green
# lines are drawn.
sub draw_outline {
    my ($gd, $grid, $xy, $bg) = @_;
    $gd->rectangle(40, 4, 482, 100, $grid);
    $gd->filledRectangle(41, 5, 481, 99, $bg);
    $gd->line(40, 4, 40, 100, $xy);
    $gd->line(38, 100, 482, 100, $xy);
}

# This function draws the grid lines.
sub draw_grid {
    my ($gd, $xy, $grid) = @_;

    # horizontal
    $gd->line(41, 26, 482, 26, $grid);
    $gd->line(38, 26, 40, 26, $xy);
    $gd->line(41, 63, 482, 63, $grid);
    $gd->line(38, 63, 40, 63, $xy);

    # vertical
    for (my $x = 77; $x <= 442; $x += 73) {
        $gd->line($x, 4, $x, 99, $grid);
        $gd->line($x, 100, $x, 102, $xy);
    }
}

# This function saves the $gd image to a file named
# "feed_name-start_date-end_date.png"
sub save_image {
    my ($gd, $feed, $start_date, $end_date, @data) = @_;

    my $filename = "$feed-$start_date-$end_date.png";
    $filename =~ s|/|_|g;

    open my $fh, '>', $filename or die $!;
    print $fh $gd->png;
    close $fh;

    print "Done. Image written to $filename\n";
}

# This function draws the date thingies on the x axis.
sub draw_date {
    my ($gd, $item, $text_color, $x) = @_;
    my @mons = qw/Nul Jan Feb Mar Apr May Jun Jul Aug Sep Oct Nov Dec/;

    my ($y, $m, $d) = $item->{date} =~ /(\d{4})-(\d{2})-(\d{2})/;
    $m = $mons[$m];
    my $text1 = sprintf("%s-", $m);
    my $text2 = sprintf("%s-%d", $m, $y);

    my @bounds = GD::Image->stringTTF($text_color, './DejaVuSans.ttf', 7, 0, 0, 0, $text1);
    my $offset = $bounds[4];

    $gd->stringTTF($text_color, './DejaVuSans.ttf', 7, 0, $x-$offset+2, 114, $text2);
}

# This function draws the feed usage numbers on the y axis.
sub draw_count {
    my ($gd, $count, $text_color, $y) = @_;

    my $text = int $count;

    my @bounds = GD::Image->stringTTF($text_color, './DejaVuSans.ttf', 7, 0, 0, 0, $text);
    my $width = $bounds[4] - $bounds[6];

    $gd->stringTTF($text_color, './DejaVuSans.ttf', 7, 0, 34-$width, $y+4, $text);
}

# This function creates the GD image and draws everything.
sub draw_feedburner_image {
    my ($feed, $start_date, $end_date, @data) = @_;

    print "Creating the awesome feedburner image.\n";

    my $gd = GD::Image->new(490, 120, 1);
    my $white  = $gd->colorAllocate(0xff, 0xff, 0xff);
    my $green  = $gd->colorAllocate(0x95, 0xcf, 0x9c);
    my $bg     = $gd->colorAllocate(0xf2, 0xf8, 0xfc);
    my $grid   = $gd->colorAllocate(0xcc, 0xce, 0xce);
    my $xy     = $gd->colorAllocate(0x80, 0x80, 0x80);
    my $alphagrid = $gd->colorAllocateAlpha(0xcc, 0xce, 0xce, 0x30);
    my $border = $gd->colorAllocate(0x68, 0x72, 0x79);
    my $text   = $gd->colorAllocate(0, 0 , 0);

    $gd->alphaBlending(1);
    $gd->filledRectangle(0, 0, 489, 119, $white);
    $gd->setAntiAliased($border);

    draw_outline($gd, $grid, $xy, $bg);

    my $t_height = 90;
    my $t_width = 441;
    my $max_circulation = max map { $_->{circulation} } @data;

    my $compress_factor = @data/$t_width;

    if ($compress_factor > 1) {
        @data = drop_data($t_width, @data);
    }
    elsif ($compress_factor < 1) {
        @data = dupe_data($t_width, @data);
    }

    my ($prev_x1, $prev_y1);
    my $x = 41;
    my %x_markers = (77 => 1, 150 => 1, 223 => 1, 296 => 1, 369 => 1, 442 => 1);
    for my $item (@data) {
        my $height = int($item->{circulation}/$max_circulation * $t_height);
        my ($x1, $y1, $x2, $y2) = ($x, 99, $x, 99-$height);
        $gd->line($x1, $y1, $x2, $y2, $green);
        if ($prev_x1) {
            $gd->line($prev_x1, $prev_y1, $x2, $y2, gdAntiAliased);
        }
        ($prev_x1, $prev_y1) = ($x1, $y2);

        if (exists $x_markers{$x}) {
            draw_date($gd, $item, $text, $x)
        }

        $x++;
    }

    draw_grid($gd, $xy, $alphagrid);
    draw_count($gd, 0,  $text, 100);
    draw_count($gd, $max_circulation * 74/90, $text, 26);
    draw_count($gd, $max_circulation * 37/90, $text, 63);
    save_image($gd, $feed, $start_date, $end_date);
}

# The main function, does everything.
sub main {
    check_dejavu_sans;

    my $feed = shift || usage();
    my $start_date = shift || find_start_date($feed);
    my $end_date = shift || today();

    unless ($start_date =~ /^\d{4}-\d{2}-\d{2}$/) {
        die "Invalid start date. Format: YYYY-MM-DD."
    }
    unless ($end_date =~ /^\d{4}-\d{2}-\d{2}$/) {
        die "Invalid end date. Format: YYYY-MM-DD."
    }

    print "Getting feed data for $feed from $start_date to $end_date\n";
    my @feed_data = get_feed_data($feed, $start_date, $end_date);

    draw_feedburner_image($feed, $start_date, $end_date, @feed_data);
}

main @ARGV;
Download: catonmat.net/ftp/generate_feedburner_graph.perl
Let's test run it.
$ generate_feedburner_graph.pl catonmat
Finding feed's start date...
Trying 2009-05-17 as start date...
Trying 2008-11-17 as start date...
Trying 2008-05-17 as start date...
Trying 2007-11-17 as start date...
Trying 2007-05-17 as start date...
Found 2007-07-15 as start date!
Getting feed data for catonmat from 2007-07-15 to 2009-11-17
Creating the awesome feedburner image.
<strong>Done. Image written to catonmat-2007-07-15-2009-11-17.png</strong>
Here is the result:
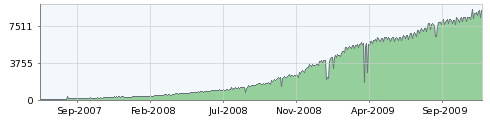 catonmat.net feed statistics from 2007-07-15 to 2009-11-17.
It looks awesome again. I love it!
As I was writing this I had the coolest idea to make a set of tools for probloggers. I added this idea to my idea-list and I'll make it happen. This tool will be the first in problogger tool suite.
Download generate_feedburner_graph.pl
Download link: catonmat.net/ftp/generate_feedburner_graph.perl
And finally, help me reach 10,000 subscribers. If you haven't yet subscribed – subscribe to my blog and see you next time!