 Hey everyone! Another year has passed and it's now 4 years since I've been blogging here on catonmat! In this post I want to summarize this year's statistics.
See the one year of blogging, two years of blogging and three years of blogging for the previous year statistics.
Let's start this year's stats with traffic:
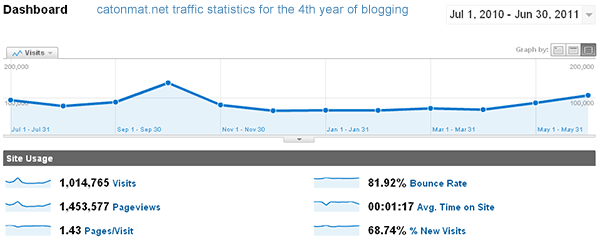 Traffic statistics from Google Analytics for Jul 1, 2010 - Jul 1, 2011.
So catonmat had 1 million visitors during the last 12 months. That's 83,000 visitors per month or 2700 visitors per day. These visitors have generated 1.45 million page views, which is 120,000 page views per month, or 4000 page views per day. That's a lot less than the last year because I am now doing a startup and I don't have that much time to blog. I wrote just 16 posts last year, compared to 43 articles that I did two years ago.
Here is Feedburner statistics. I used my Feedburner graph generator to produce it.
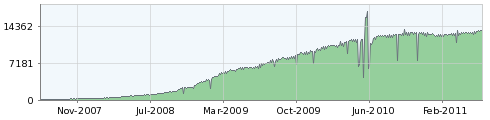 Feedburner subscriber statistics for Jul 15, 2007 - Jul 1, 2011.
Last year I said, "if it keeps going the same way, I expect to have around 17,000 subscribers the next year." Well this didn't come true, and I have gotten only up to 13,500 subscribers. Still cool.
I am also up to 686 followers at GitHub and 1998 followers on Twitter. I didn't keep metrics of this last year and the year before but now I will. Now who's going to be my 700th follower on GitHub and who's going to be 2000th follower on twitter? :)
Next, top 10 countries my visitors came from,
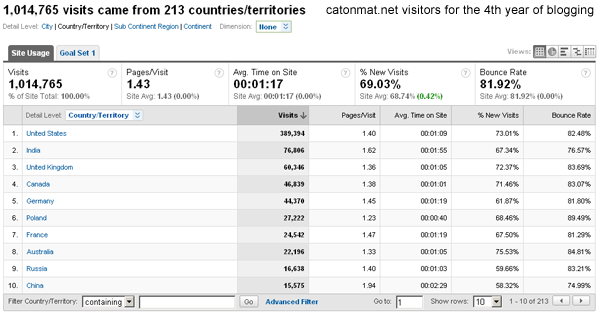 Country statistics from Google Analytics for Jul 1, 2010 - Jul 1, 2011.
USA is #1 with 38% of the traffic, then India with 7.5%, then United Kingdom with 5.9%, then Canada with 4.6% and Germany with 4.3%. Poland, France, Australia, Russia and China take the bottom top 10 with less than 4.3%.
Since I wrote only 16 posts during the last year, I can list them all here, sorted by views:
- I pushed 20 more of my projects to GitHub (304,354 views)
- Reflections on Node.js Knockout Competition (247,893 views)
- Announcement: I am doing a startup - StackVM! (182,534 views)
- Donald Knuth never told Steve Jobs that he was full of crap (40,540 views)
- Working with git? These aliases will save you hours! (35,282 views)
- Announcing Browserling! (34,177 views)
- StackVM Demo Video #2 (29,577 views)
- Announcing my first e-book "Awk One-Liners Explained" (28,815 views)
- How to write a simple TCP Server in Haskell (22,674 views)
- Introducing node-lazy - lazy lists for node.js (17,445 views)
- How to delete cookies, cache and history in all major browsers (17,295 views)
- Restricting what programs a user can run on Windows via Group Policy Objects (15,592 views)
- Three Years of Blogging (10,582 views)
- Why chmod text modes are more powerful than octal (8,819 views)
- A TCP Proxy in Perl (7,818 views)
- Perl One-Liners Explained, Part VI: Selective printing and deleting of lines (7,647 views)
Now let's have some 4 year birthday cake,

And let's meet for the cake next year again! See you!