
In this article I'll show you how the theory does not always match the practice.
I'm sure you all know the linear time algorithm for finding Fibonacci numbers. The analysis says that the running time of this algorithm is O(n). But is it still O(n) if we actually run it? Let's find out!
Let's start with the simplest linear time algorithm in Python:
def LinearFibonacci(n):
  fn = f1 = f2 = 1
  for x in xrange(2, n):
    fn = f1 + f2
    f2, f1 = f1, fn
  return fn
The theory says that this algorithm should run in O(n) time – given the n-th Fibonacci number to find, the algorithm does a single loop up to n.
Now let's verify if this algorithm is really linear in practice.
If it's linear, then the plot of n vs. running time of LinearFibonacci(n) should be a line.
I plotted these values for n up to 200,000 and here is the plot that I got:
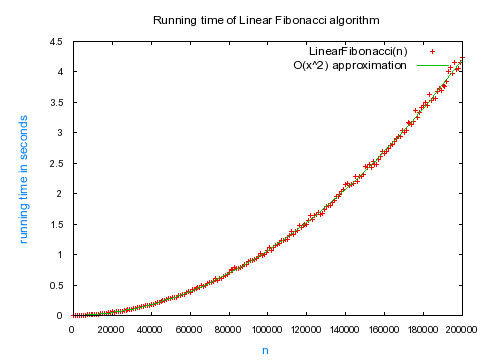 Note: Each data point was averaged over 10 calculations.
Oh no! This does't look linear at all! It looks quadratic! I fitted the data with a quadratic function and it fit perfectly.
Do you know why this seemingly linear algorithm went quadratic? Think and scroll down for the answer.
.
.
.
.
.
.
.
.
.
The answer is that the theoretical analysis assumes that all the operations in the algorithm executed in constant time.
But this is not the case when we run the algorithm on a real machine!
As the Fibonacci numbers get larger, each addition operation for calculating the next Fibonacci number "fn = f1 + f2" runs in time proportional to the length of the previous Fibonacci number. It's because these huge numbers no longer fit in the basic units of computation in the CPU and a big integer library is required. The addition of two numbers of length O(n) in a big integer library takes time of O(n).
I'll show you that the running time of the real-life linear Fibonacci algorithm really is O(n^2) by taking into account this hidden cost of a bigint library.
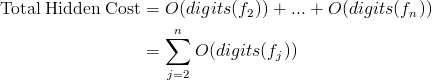
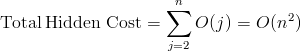
In every iteration, we have a hidden cost of O(number of digits of fi) = O(digits(fi)). Let's sum these hidden cost for the whole loop up to n:
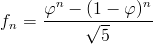
Now, let's find the number of digits in the n-th Fibonacci number. To do that, let's use the well-known Binet's formula, which tells us that the n-th Fibonacci number fn can be expressed as:
It is also well-known that the number of digits in a number is integer part of log10(number) + 1. Therefore, the number of digits in n-th Fibonacci number is:
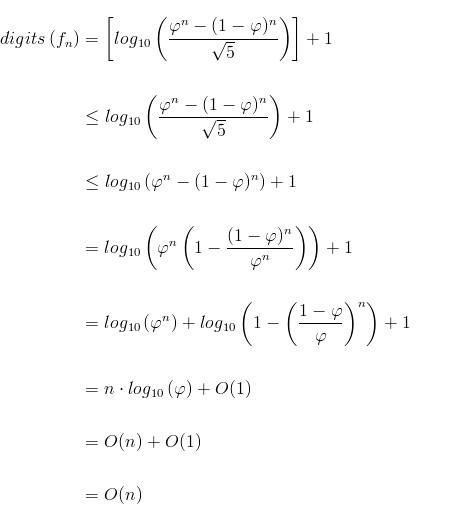
If we now sum all the hidden costs for finding the n-th Fibonacci number we get:
There we have it. In practice, the running time of this linear algorithm is actually overshadowed by a hidden quadratic term, if we take into consideration that each addition operation runs proportionally to the length of addends.
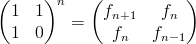
Next time I'll show you that if the addition operation runs in constant time, then the algorithm is truly linear; and later I will do a similar analysis of the logarithmic time algorithm for finding Fibonnaci numbers that uses this awesome matrix identity:
See you next time!